In the charts section, you have access to the Dashboards and the Export.
The dashboards
By default, when you land on the dashboard page, you will see demo dashboards. We provide those dashboards to let you see the kind of data you will be able to collect even if you don’t have data yet. You can learn more about the meaning of these dashboards in our articles about the dashboards.
Create a dashboard
To create a dashboard, you can take the tour that we offer. It will guide you click by click. You can click “End tour” any time, and re-take the tour later by click “Take tour” on the top right corner.
(optional) Remove the demo dashboards
If you wish to remove the demo dashboards, go to your profile and unselect the
Export
If you have access to the export category, then you can export the data you want from your network.
You need to specify:
Data type
Watchers give you all the metrics we measure for each watcher
OTS will give you the OTS and Watchers count per time range. The finest granularity for this is 15 minutes
Gate will give you data if you use VidiReports in Gate mode (from above, to count the poeple who walk through a virtual line)
Proof of play by location will give you the list of contents, and the audience per content for each location. To have such data you must first make sure that your CMS is integrated with Quividi and that you collect Audience Per Content data.
Proof of play by site will give you the same data, at a site level.
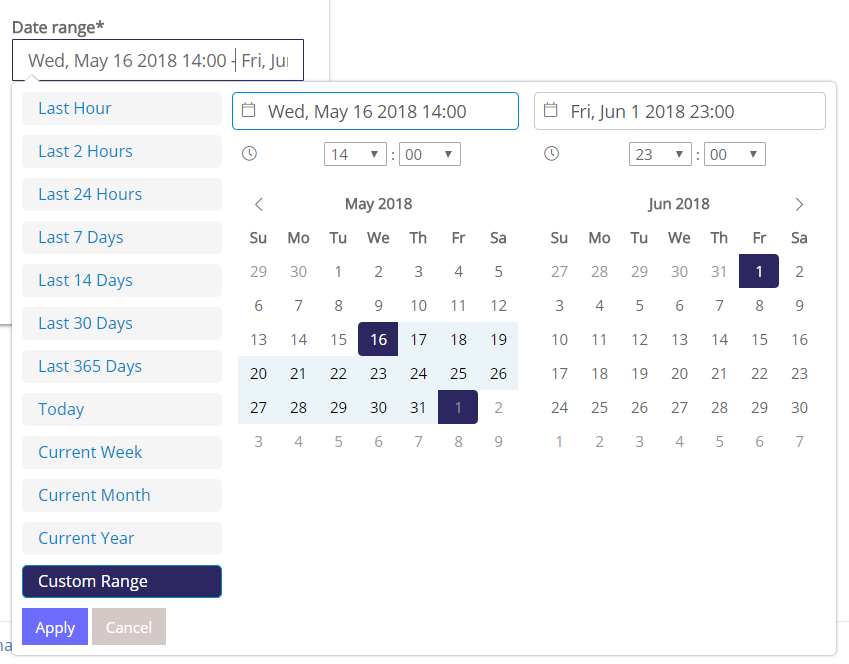
Date range
You can either pick a default option (Last hour, last 7 days, Current Month…)
or select a custom range by defining the begin date and the end date on the calendar.
Do not forget to click Apply once you are satisfied with your selection!
Time resolution
Finest gives you one line per watcher, with all the details about this watchers. If you are using VidiReports Expert, it is the only resolution in which you will have the full details that we measure (when we aggregate, we cannot provide such things as mood split, facial features and glasses, or exact age).
Anything above fine age will aggregate data to create groups of watchers. It makes your exports lighter since you don’t have as many details as we actually collected.
The finest resolution you can use for OTS is 15 minutes.
Details (optional)
Provide details by demographics will split the watcher into different demographic groups even if you choose to aggregate data
the detailed header will show all the names of the locations as well as the site and network they belong to
the verbose description will write in all letters the genders and the location names (instead of numbers, used to make the export lighter)
Filters (optional)
Attention and Dwell filter allow you to filter out any watcher that could be considered as an outsider data point
You can add a filter on fine age only if you have Expert data
You can choose to limit your export to only some hours of the day and days of the week
Locations
You can pick all the locations you want. If they have no data during the time range you picked, your export will be empty.
Once you are happy with your selection, you can click on Submit and your export will start. Once it is available, it will appear in “Your recent exports” section, and you can download it by clicking on the Download button.
We use cookies to ensure that we give you the best experience on our website. If you continue to use this site we will assume that you are happy with it.OkNo